

In the past, debugging software mostly involved looking at the error logs. That was fine for simple solutions, developed and managed by small teams. However, software has evolved from monoliths to microservices, with software comprised of disparate services, using multiple runtimes and platforms. This has given rise to a DevOps approach to building and running software, and a requirement for new tools to more efficiently establish the causes of problems in a constantly changing environment. Instana provides a real-time, automated Enterprise Observability Platform that helps Site Reliability Engineers improve the reliability and resiliency of cloud-native applications.
Instana supports a broad list of technologies, including many programming languages and frameworks, infrastructure, platforms and cloud services. It captures 100% of requests and transactions to provide metrics, logs and full end to end traces across the environments. Included in the list of supported technology is middleware from IBM, i.e. IBM MQ, WebSphere Application Server (WAS), WebSphere Liberty, and IBM DB2.
A trial version available. If you are an IBM business partner, additional sandbox & demo environments are available.
There are two key components to Instana:
- The Instana backend
This provides the UI. It can be deployed to your own infrastructure, or you can consume it as SaaS.
- An Agent
Instana provides agents for infrastructure hosts, platforms (like Kubernetes), public clouds, web and mobile. Generally speaking, the agents collect and aggregate data from multiple ‘sensors’, which is sent to the Instana backend. This is a key capability of Instana - automatic discovery and monitoring of all components, both physical (e.g hosts, containers, processes) and logical (e.g. services, endpoints, calls, traces).
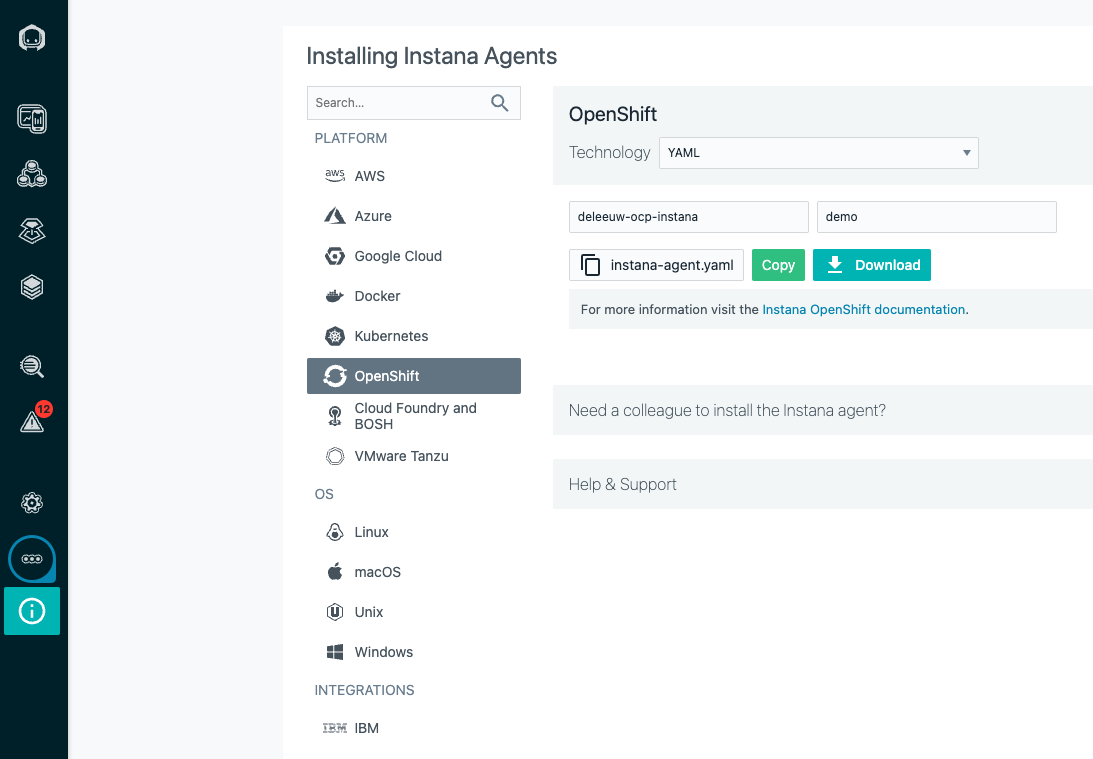
Let’s give it a try by observing an OpenShift cluster. From the Instana menu More->Agents->Installing Instana Agents, instructions are provided to download and install the agent. For OpenShift, there is a choice of Operator, Helm or Yaml based installation. I downloaded the yaml which is pre-populated with the connection details for the Instana backend:
Before applying the yaml, create the project and privileges to allow Instana to monitor all of OpenShift.
1
2
3
oc login -u system:admin
oc new-project instana-agent
oc adm policy add-scc-to-user privileged -z instana-agent -n instana-agent
Install the agent:
1
oc create -f configuration.yaml
The agent is deployed:
1
2
3
4
oc get pod -n instana-agent
NAME                  READY   STATUS    RESTARTS   AGE
instana-agent-kvxx2   2/2     Running   0          6h14m
instana-agent-tpn6t   2/2     Running   0          6h14m
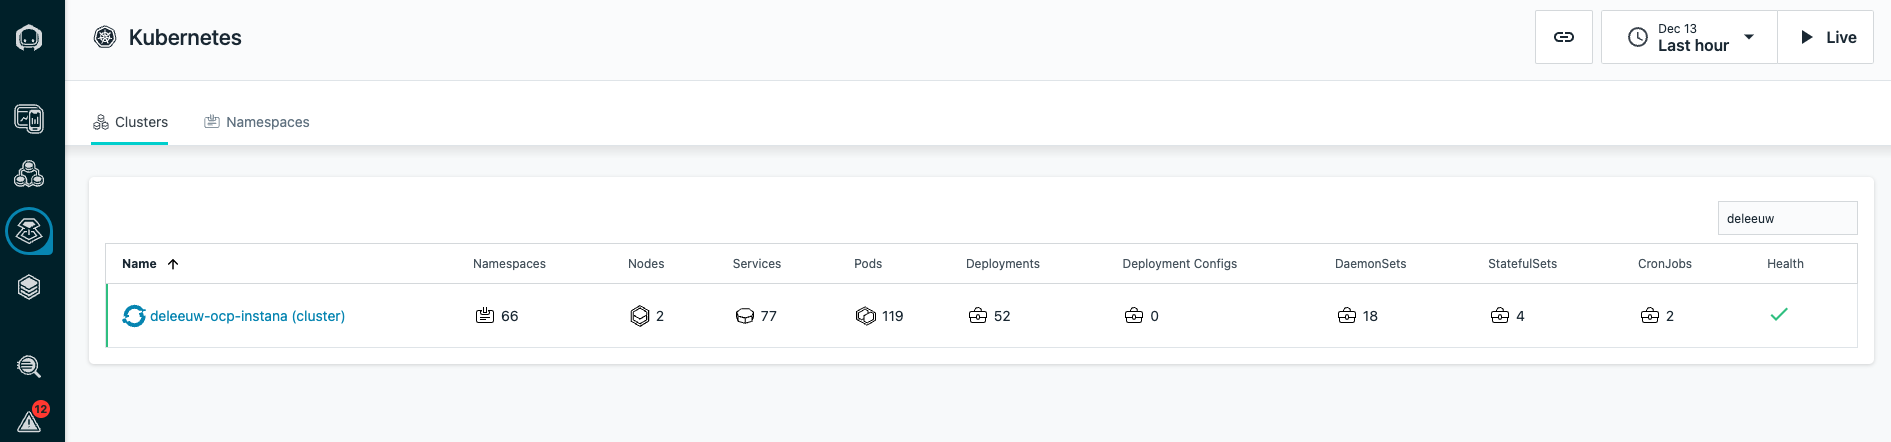
My OpenShift cluster was successfully added to Instana:
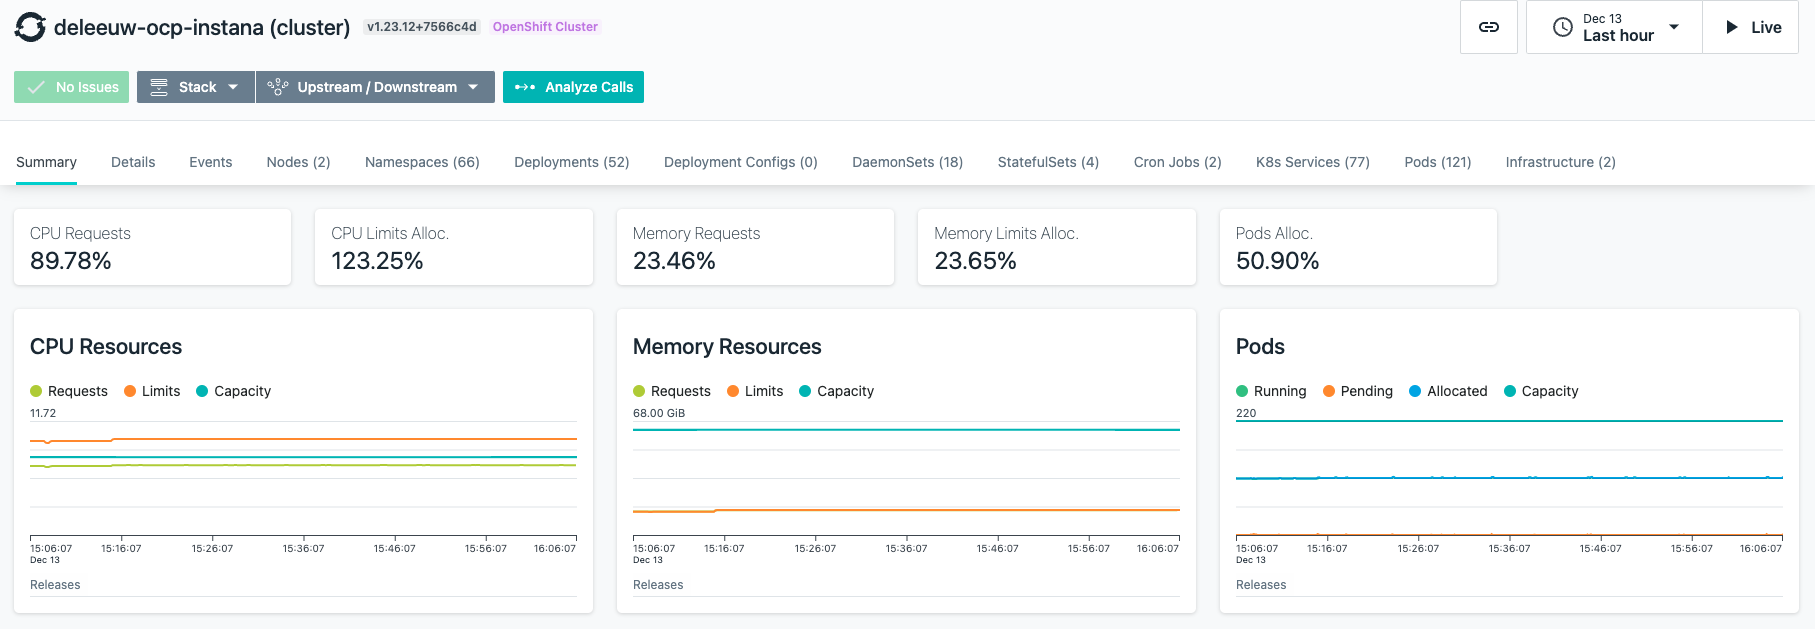
The details view demonstrates how the agent has discovered all the details of the OpenShift platform, for example all the Kubernetes resources and infrastructure:
In subsequent blogs I will demonstrate some of the key features which lay claim to Instana’s capability of making complex systems highly observable.