

WebSphere Application Server (WAS) has been around for a long time, since 1998 in fact. Its focus was on running enterprise applications that used the J2EE stack. Back in those days, applications were monoliths and methodologies were waterfall. Of course, WebSphere has evolved with the times and the influence of cloud, microservices architectures and agile methodologies spawned the more lightweight application server, WebSphere Liberty, some of which is open sourced via the Open Liberty project. Although WAS is still supported by IBM, it is likely that many customers will be looking to migrate and modernise their applications to make them compatible with Liberty and the modern world! However, in the interim, this is a perfect example of why an observability solution like Instana is valuable for improving the reliability and resiliency of applications which span heterogeneous environments, including WAS.
Fortunately, Instana is able to collect metrics from WAS and the infrastructure on which it runs. WAS is one of Instana’s built in sensors and data will be automatically collected from the existing WAS Performance Monitoring Infrastructure, including:
- Configuration (e.g. cell name, node name, installed apps, datasources etc)
- Performance metrics (e.g. threads, sessions, pool sizes etc)
In addition, Instana provides default Health Signatures and the possibility to define your own. These are used to automatically trigger events, to help avoid impending issues. For WAS there is just one health signature which enables you to configure an Alert if the web container threads are reaching the maximum limit.
You can expect Instana to tie together everything from infrastructure, WAS applications and metrics. Let’s take a look at how to set this up, and test a problem scenario.
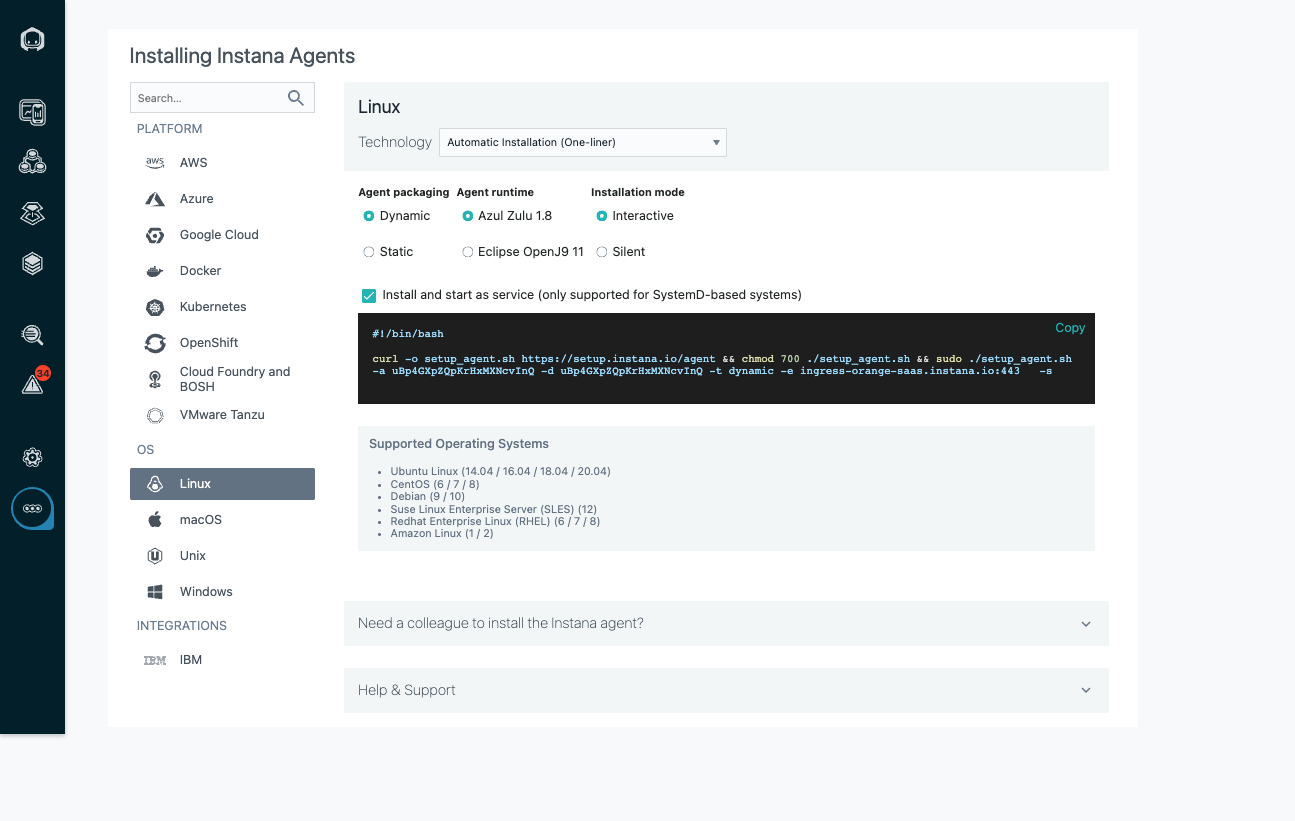
Installing the Instana Agent
Having already installed WAS 9 on an Ubuntu, I also need to install the Instana agent onto the host. Instana provides several options to achieve this. I simply ran the script:
Instana provides an Infrastracture view which locates and observe specific hosts. It uses a query syntax providing entities to query on, e.g. by host name, application, platform etc. I used a simple query to locate the host where I had installed the Instana agent:
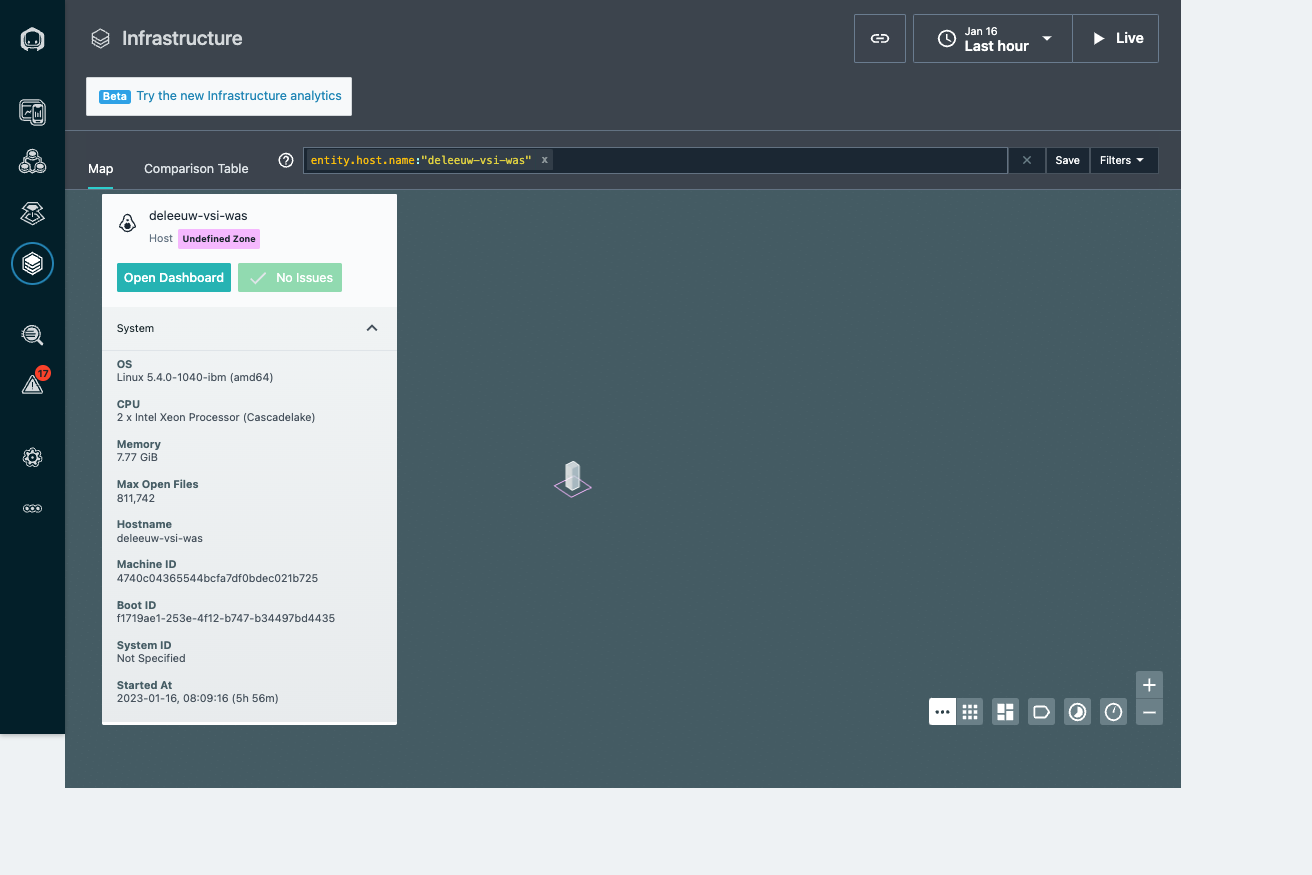
The host was listed as expected. However, it showed a zone of “undefined”. When installing the agent on IaaS from some clouds (e.g. AWS), this would be configured automatically. If not, it’s possible to manually set the zone information, which helps to organise the infrastructure monitored by Instana. The agent is configured by the /opt/instana/agent/etc/instana/configuration.yaml, see the documentation for more detail. I added the following:
1
2
3
com.instana.plugin.generic.hardware:
  enabled: true # disabled by default
  availability-zone: 'IBM Cloud/WAS'
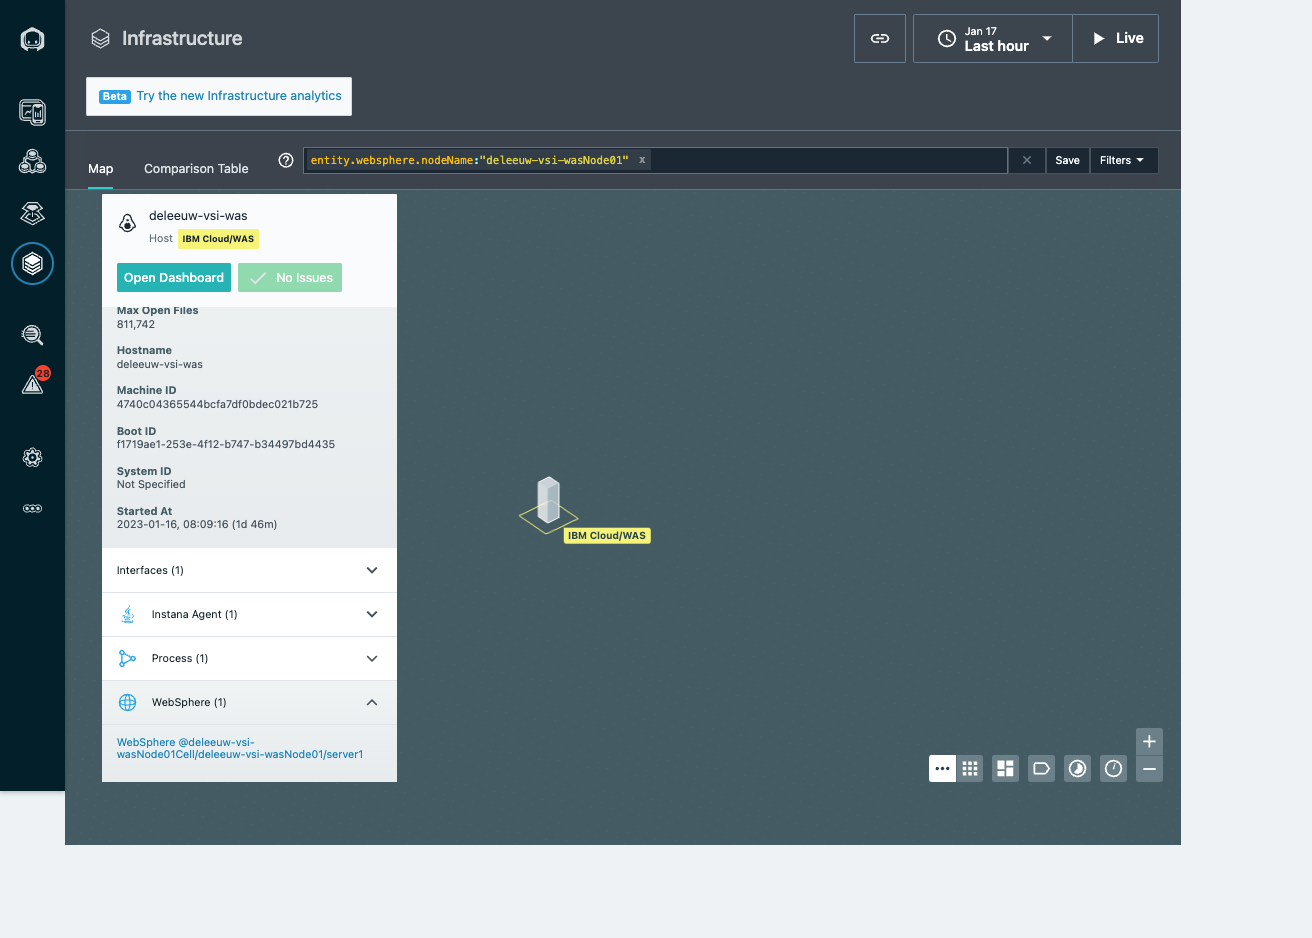
The change took immediate effect. Instana provides the following dashboard showing metrics for the deleeuw-vsi-was host:

Configuring WAS for Instana
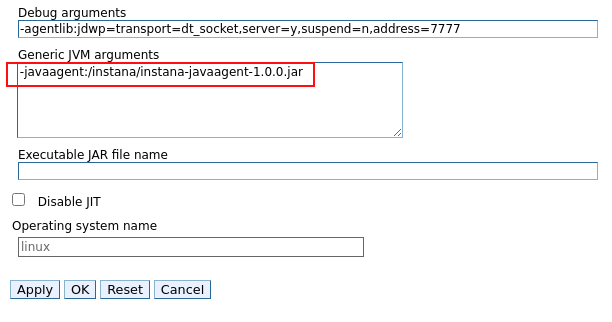
Be aware of some IBM J9 limitations with the requirement for additional Java command line settings which differ for SDK 6 or 7, and SDK 8. I am using SDK 8 and the recommendation is to set an -javaagent property using an Instana agent jar (instana-javaagent-1.0.0.jar). An alternative is possible using only option -XX:+EnableHCR, but apparently this may have a slight performance impact and will be deprecated in future.
Let’s create a WAS profile and set the -javaagent property:
1
2
cd /opt/IBM/WebSphere/AppServer
./manageprofiles.sh -create
The result was as follows, including a warning which should be resolved after we add the -javaagent to the JVM command line.
1
2
*** java.lang.instrument ASSERTION FAILED ***: "jvmtierror == JVMTI_ERROR_NOT_AVAILABLE" at JPLISAgent.c line: 1009
INSTCONFSUCCESS: Success: Profile AppSrv01 now exists. Please consult /opt/IBM/WebSphere/AppServer/profiles/AppSrv01/logs/AboutThisProfile.txt for more information about this profile.
Start the server server1:
1
2
/opt/IBM/WebSphere/AppServer/bin
./startServer.sh server1
The response is:
1
2
3
4
ADMU0128I: Starting tool with the AppSrv01 profile
ADMU3100I: Reading configuration for server: server1
ADMU3200I: Server launched. Waiting for initialization status.
ADMU3000I: Server server1 open for e-business; process id is 11597
Download the instana-javaagent-1.0.0.jar:
1
mvn dependency:copy -Dartifact=com.instana:instana-javaagent:1.0.0 -DoutputDirectory=/instana
Use the WAS admin console to update the JVM process definition:
Restart the application server:
1
2
./stopServer.sh server1
./startServer.sh server1
Observing WAS
The WAS node is now visible in Instana:
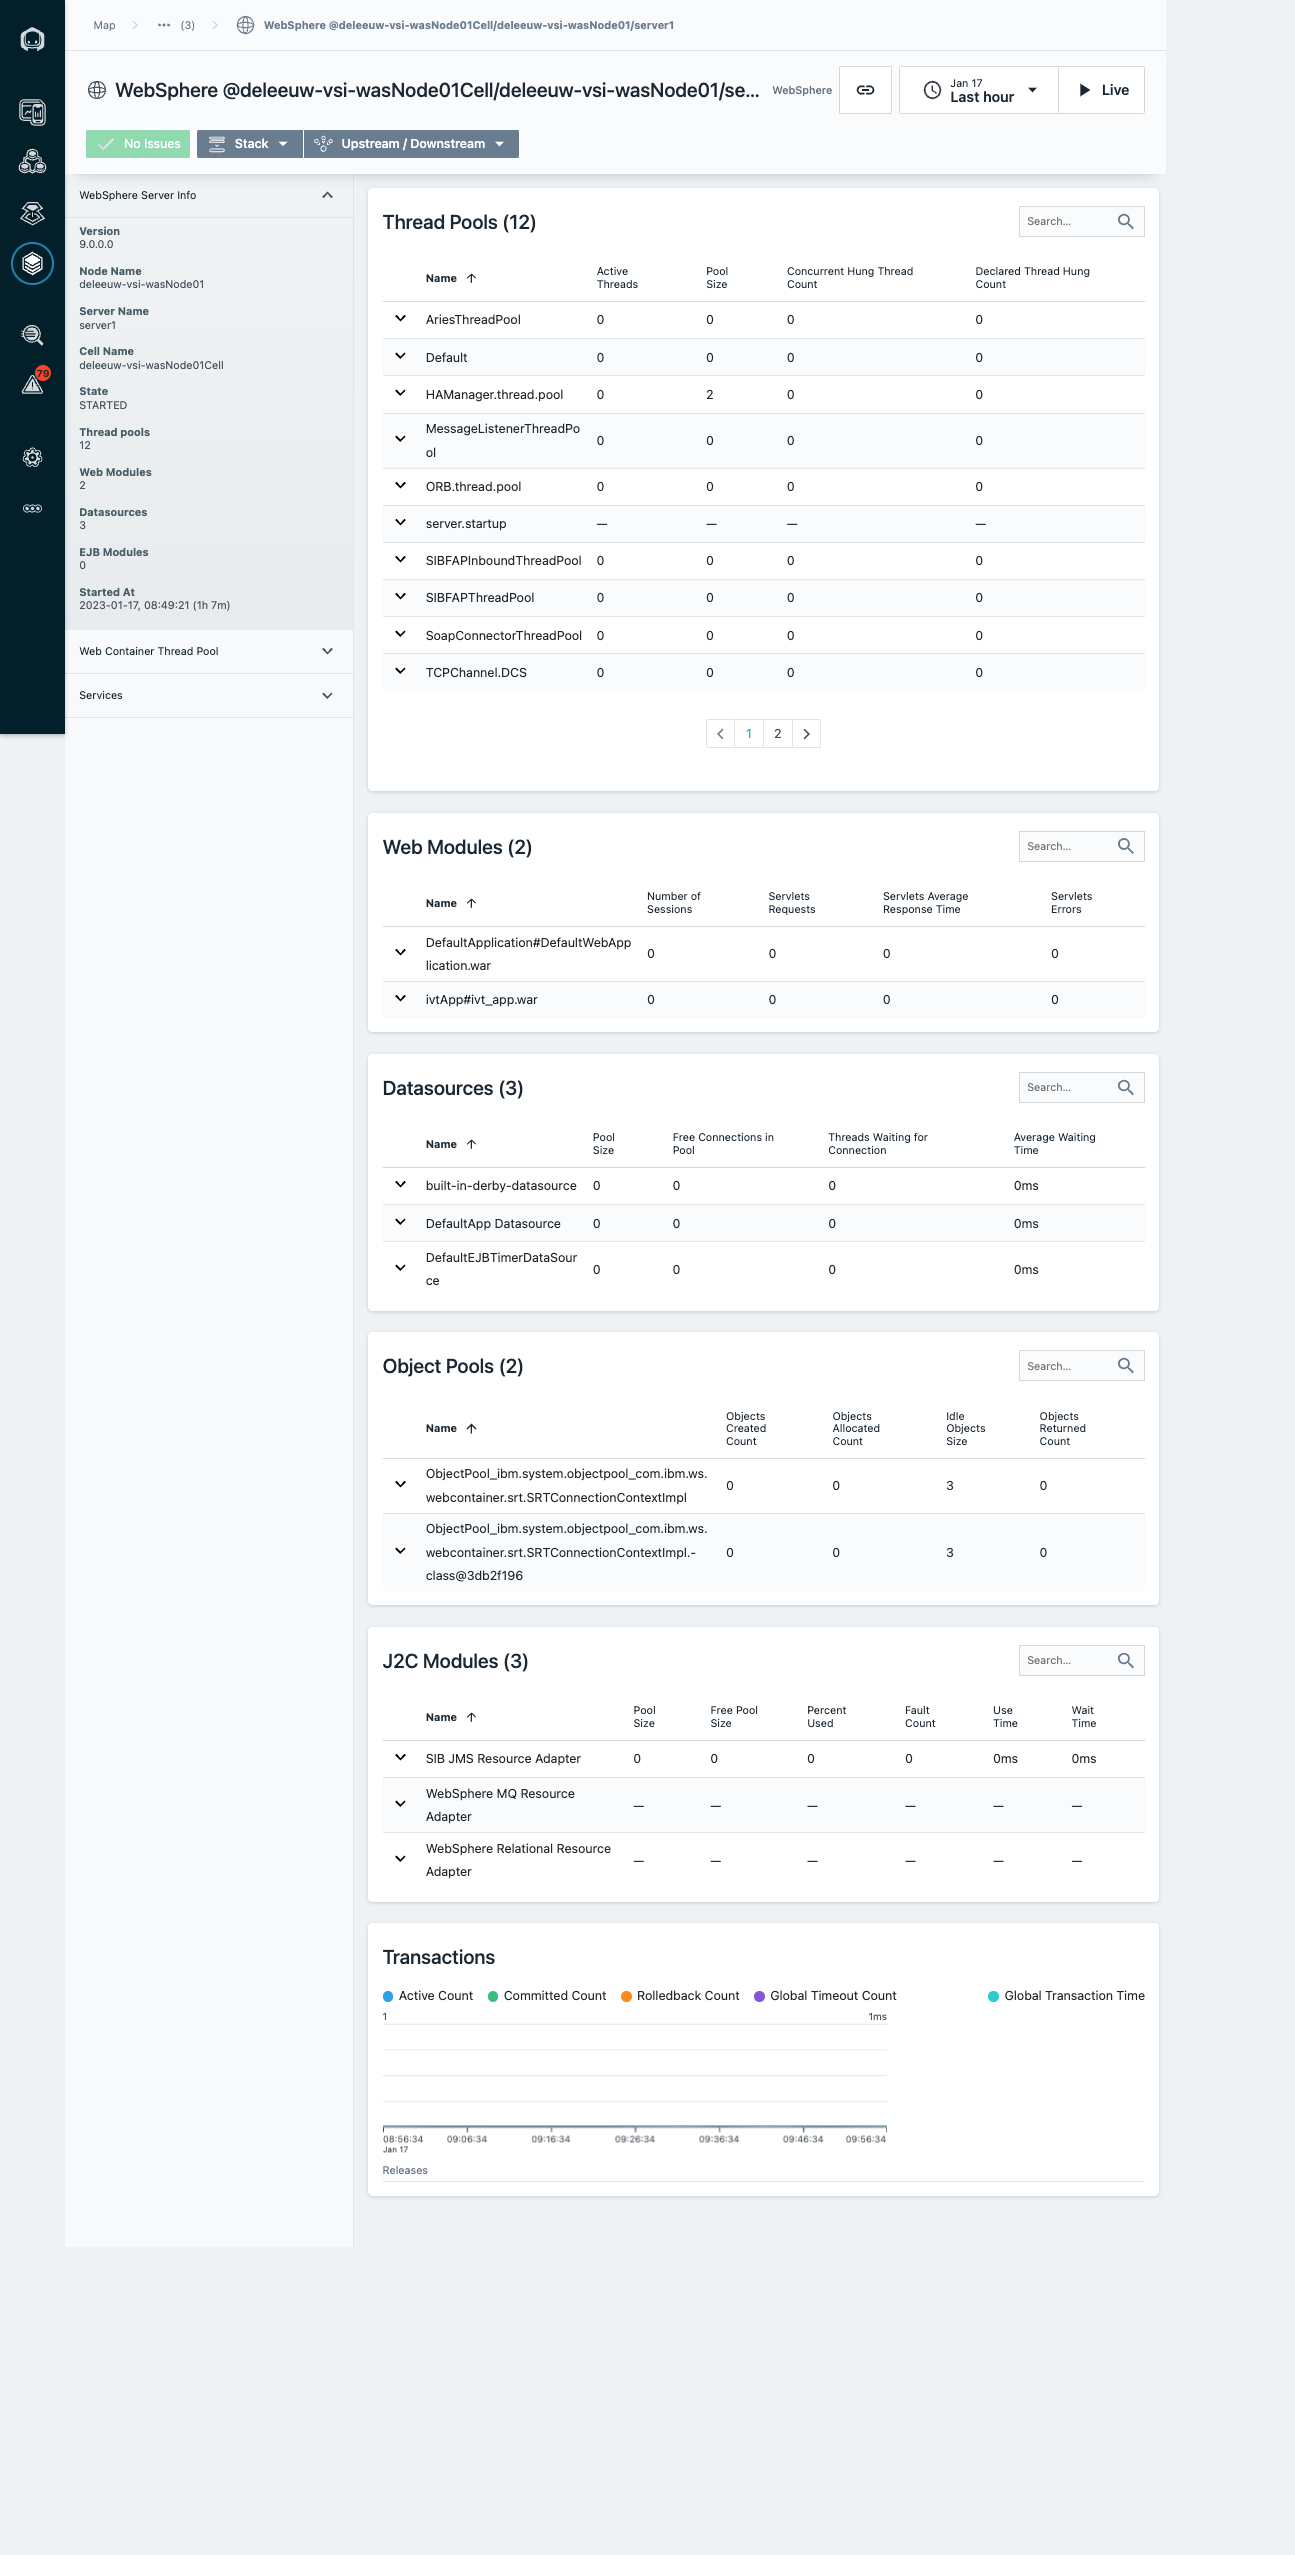
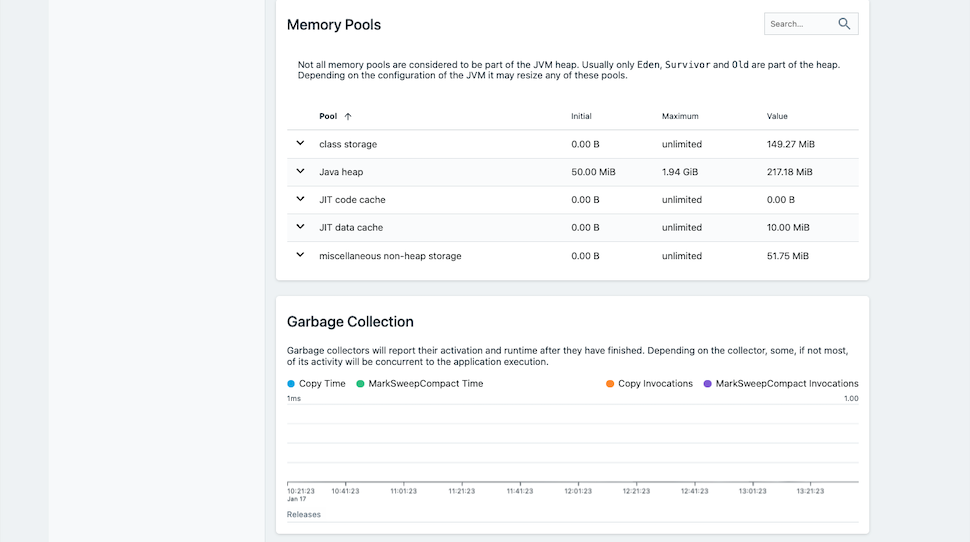
Clicking the WebSphere link displays all the WAS specific metrics:
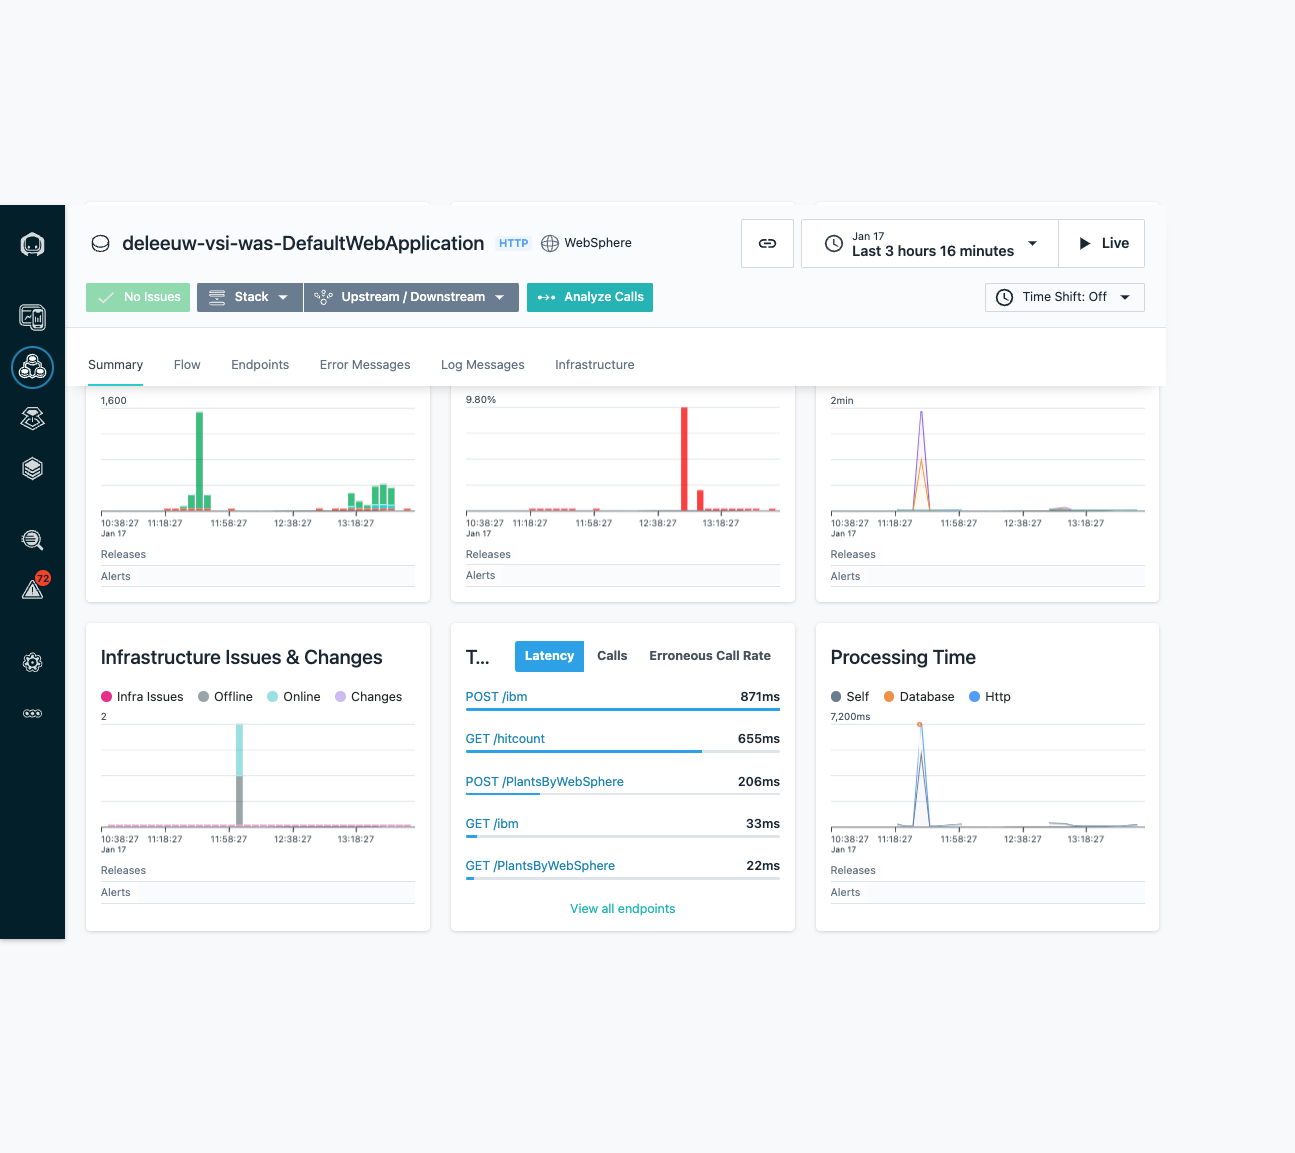
Other views show the top endpoints for the WAS DefaultApplication, which typically includes a server server1 and some samples:
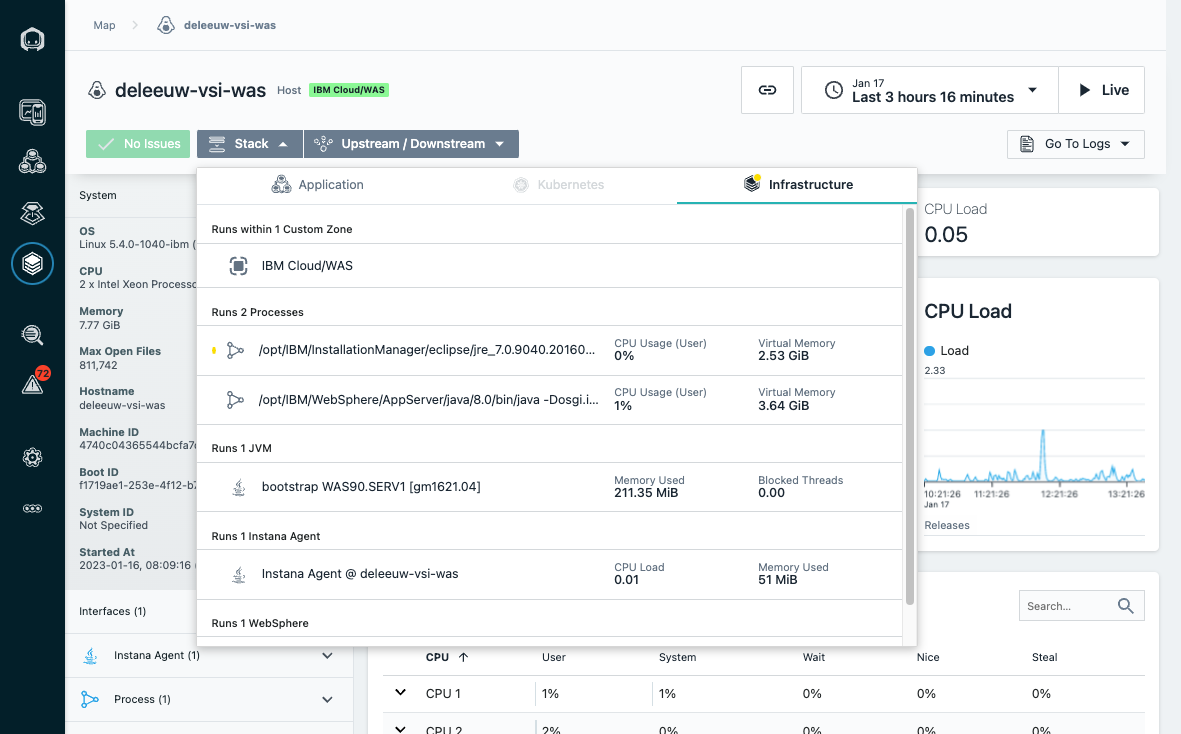
Returning to the deleeuw-vsi-host in the Infrastructure view, you can use the Stack button to see the processes running on the host, including the WAS JVM:
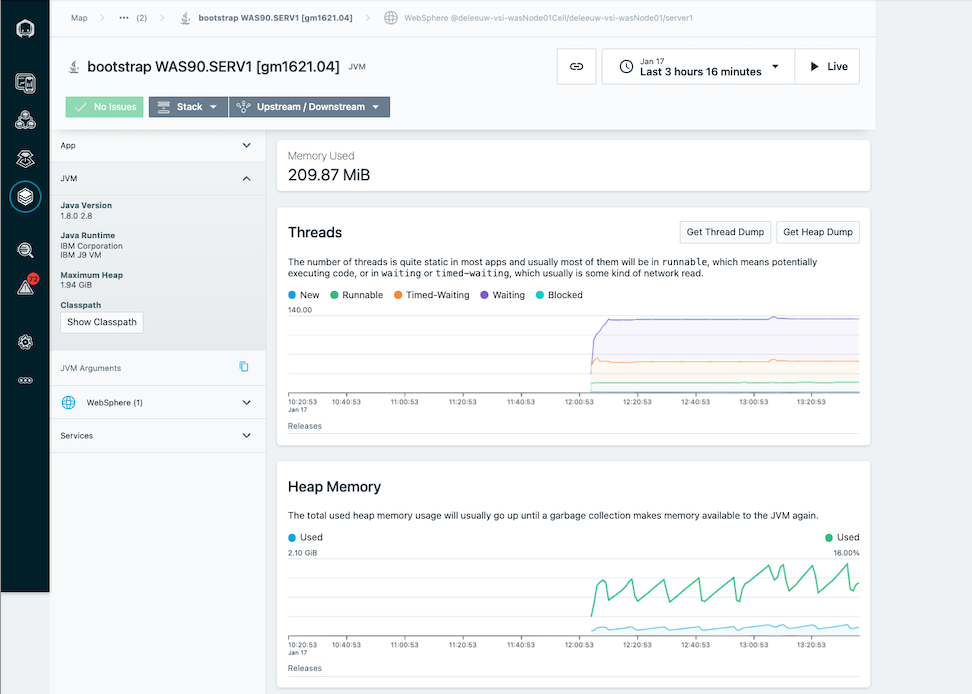
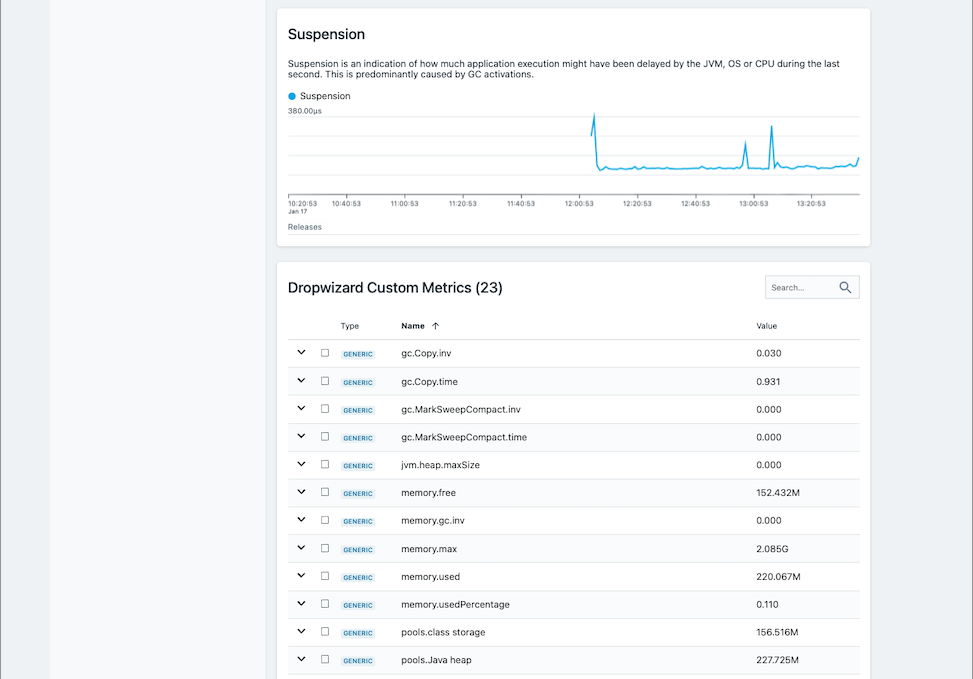
Selecting the JVM shows the Java specific metrics:
Setting up Alerts
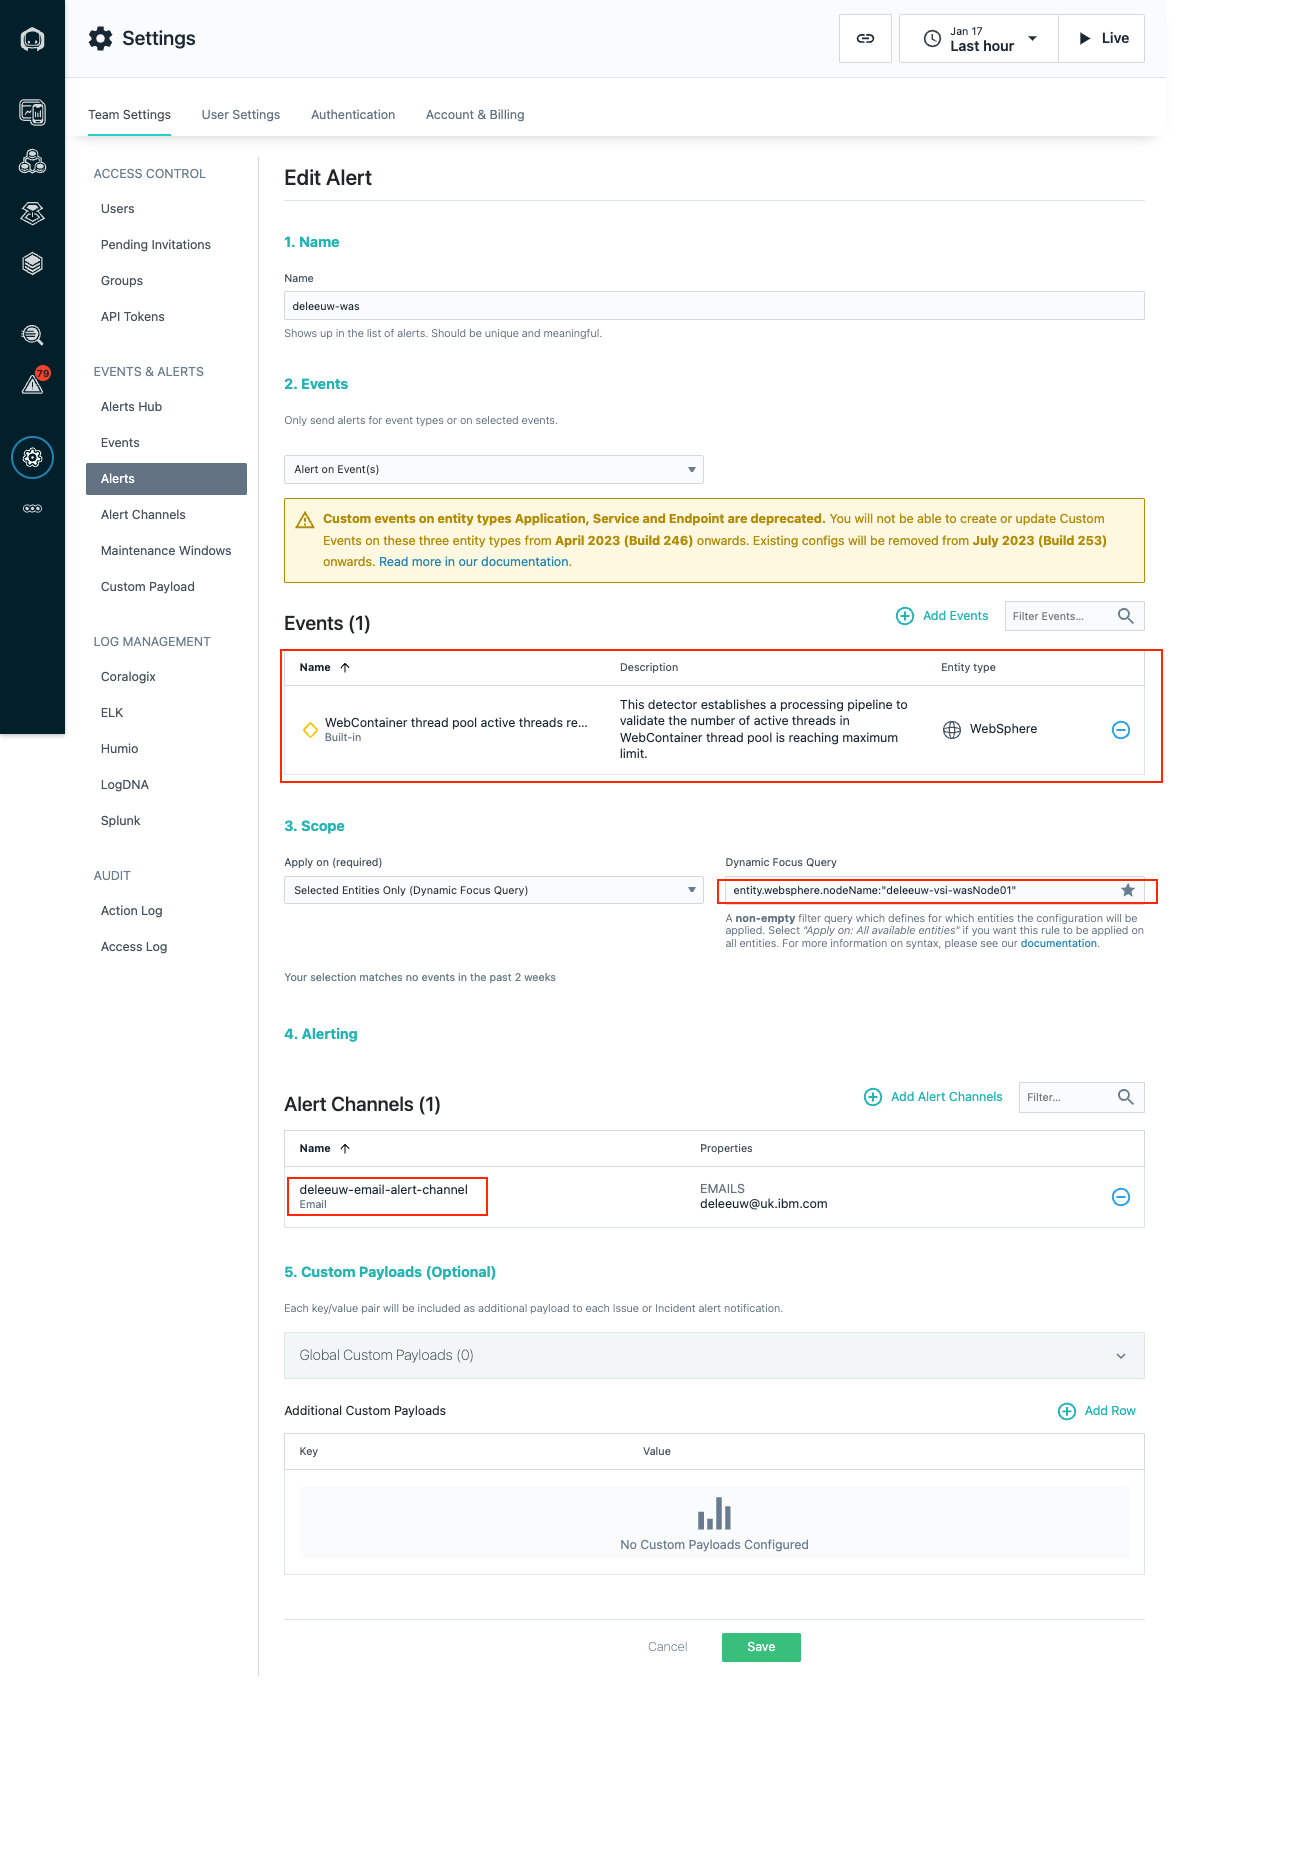
Let’s set up an alert using one of the built-in ‘Health Signatures’ that Instana defines for WAS. I created an Alert, scoped to the deleeuw-vsi-wasNode01 WAS Node, which will be triggered if the WebContainer thread pool is reaching its maximum limit. If the alert is triggered, I should be notified via an email alert channel I had previously configured:
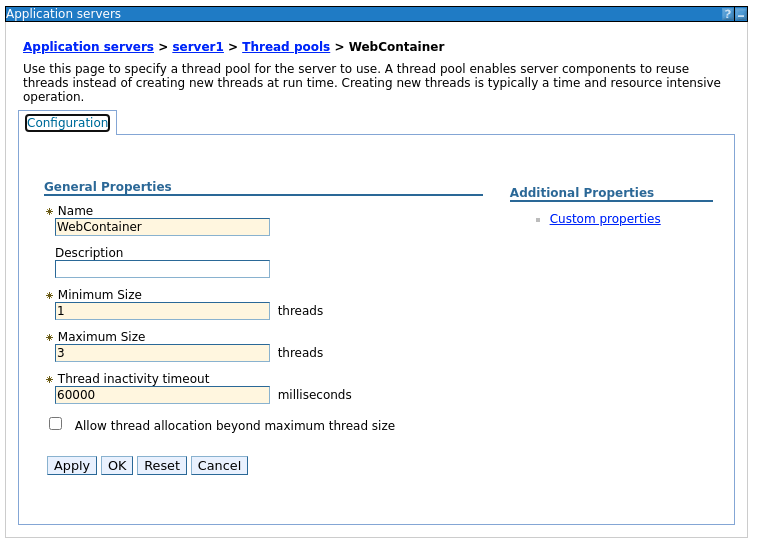
To test this out, I placed an extreme limit on WAS by restricting the WebContainer thread pool to just three:
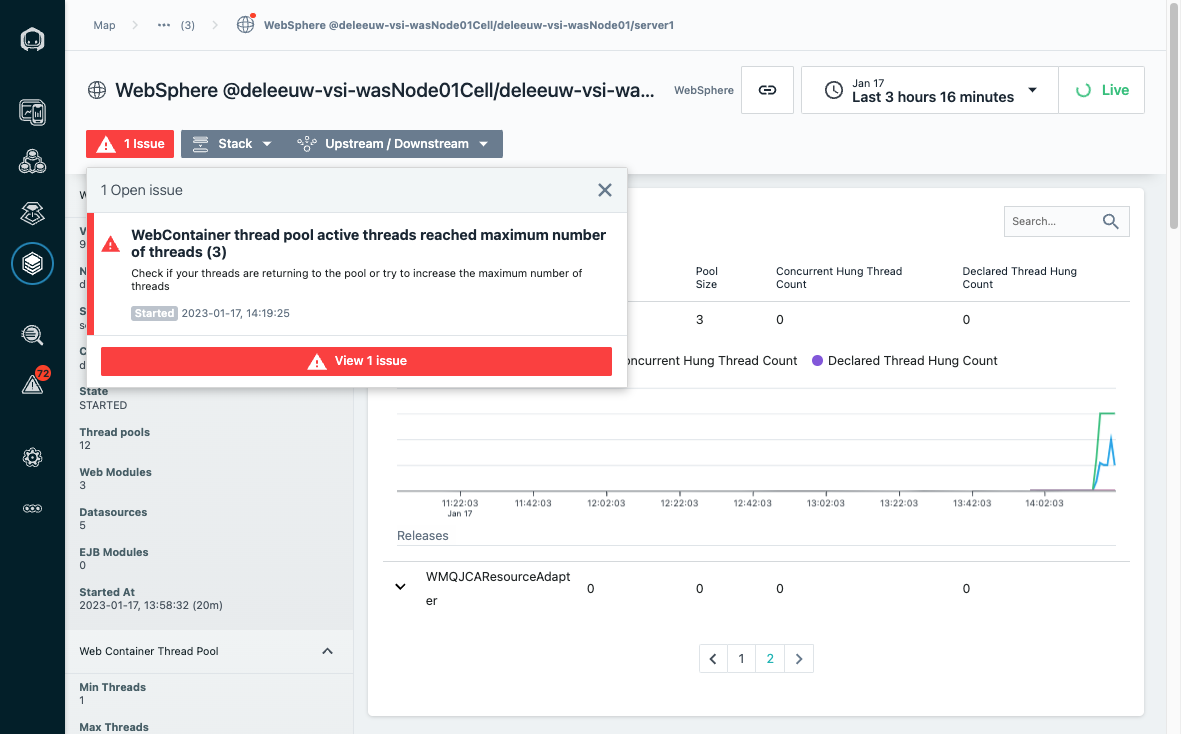
I used some simple curl commands to interact with the typical samples like /snoop, /hello and /hitcount. Pretty quickly the WebContainer thread pool increased, nearing the maximum size, which triggered an issue in the UI:
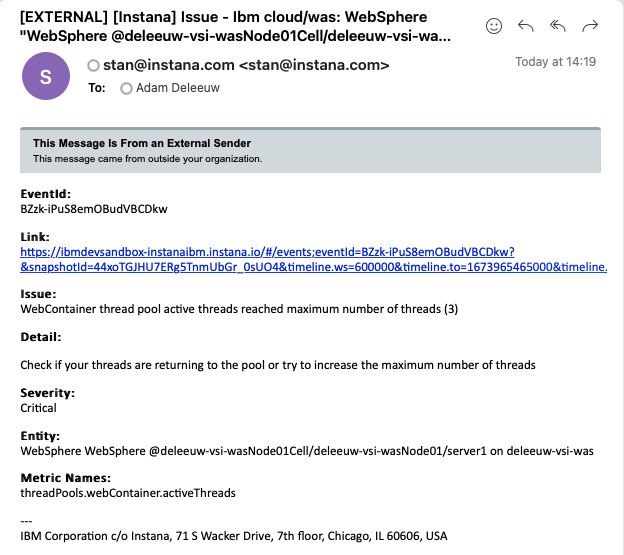
Due to the Alert via email configuration created previously, I also received email notification:
For more information about using Instana to observe WAS, see these resources: